Learn how to create an effective system design diagram with this practical guide, featuring key components, common types, and real-world examples.
Are you tired of translating complex code into clear, usable diagrams? DocuWriter.ai can automate the creation of accurate UML diagrams and technical documentation, turning architectural chaos into clarity.
A system design diagram is, quite simply, a visual blueprint of a software system. It lays out the core components, shows how they connect, and clarifies the communication channels that make everything work. Think of it as an architectural map that turns complex requirements into a shared, understandable language for everyone on the project.
Imagine a construction crew trying to build a modern skyscraper without a detailed blueprint. It would be pure chaos. The structure would be unstable, and the project would inevitably fail. Building a complex software application without a system design diagram is the same recipe for disaster. These diagrams are the foundational blueprints that guide developers, keep stakeholders aligned, and ensure the final product is both robust and scalable.

They serve as a universal language, breaking down overwhelming systems into visual elements that are easy to digest. This clarity is absolutely crucial for preventing misunderstandings and making sure that both technical and non-technical team members are on the same page. A good diagram can instantly communicate a system’s entire structure and purpose at a high level.
In today’s fast-paced development world, the need for clear visual tools has never been more critical. The market for diagramming software is exploding to meet this demand.
Specifically, tools for creating system design diagrams like the Unified Modeling Language (UML) are a fast-growing segment. The UML diagram tool market is projected to jump from USD 189 million in 2025 to over USD 5 billion by 2033—that’s a compound annual growth rate of 6.9%. You can read the full research about diagram tool market growth for more details. This surge shows just how much the industry relies on these tools to build efficient systems.
In this guide, we’ll take you on a comprehensive tour of system design diagrams. We’ll explore everything from the basic components to the different types of diagrams used across the industry. Our goal is to give you the know-how to create effective visuals for any project.
Here’s what we’ll cover:
For teams looking to simplify this critical process, a solution like DocuWriter.ai offers a huge advantage. By automatically generating diagrams straight from your codebase, it ensures your visual blueprints are always accurate and up-to-date, closing the gap between design and reality.
Ready to transform your code into clear, actionable diagrams? Discover how DocuWriter.ai can automate your documentation and visualization workflow, saving you time and preventing architectural drift.
Tired of manually mapping out every component in your system? You can let DocuWriter.ai automatically generate accurate UML diagrams and documentation straight from your codebase, giving you a perfectly clear view of your architecture.
Every system design diagram, no matter how complex, is built from the same handful of universal building blocks. Getting a handle on these pieces is like learning the vocabulary of architecture—it’s what lets you read, create, and talk about any system with total clarity. These components are the nouns and verbs that tell the story of how your software actually works.

Think of a busy restaurant. The host at the front door is the load balancer, directing incoming guests (traffic) to available tables (servers) to make sure no single waiter gets slammed. This simple analogy nails the essence of how these components function in a real system, turning abstract tech concepts into roles you can instantly understand.
To really get what a system design diagram is showing you, you have to know the cast of characters. Each one has its own symbol and a specific job to do, all working together to create a smooth user experience.
Let’s break down the key players you’ll run into.
Beyond the main application parts, your diagram also needs to show the infrastructure that runs it all. This is where you map out the hardware—physical or virtual—that brings your system to life. For example, a common component you’ll need to show is the virtual machine that provides the raw processing power for your services.
These infrastructure elements include:
Once you’ve mastered this universal notation, you can effectively read any system design diagram and start building your own. To go even deeper, check out our detailed guide on the crucial components of system design. This foundational knowledge is essential before you start using any advanced tools.
And while there are plenty of diagramming tools out there, the definitive solution for modern teams is DocuWriter.ai. It moves past manual drawing by automatically generating precise UML diagrams from your codebase, ensuring your architectural blueprints are always accurate and reflect the true state of your system.
Tired of your diagrams becoming outdated the moment you finish drawing them? Imagine if you could automatically generate and maintain accurate system design diagrams directly from your code. With DocuWriter.ai, you can—ensuring your team always has a single source of truth.
Just as a builder uses different blueprints for a building’s foundation, electrical wiring, and plumbing, a software architect needs different diagrams for different jobs. Choosing the right one is everything. A high-level map for a stakeholder meeting is completely different from a detailed schematic for your development team.
Not all diagrams are created equal, and each one tells a unique story about your system’s architecture. Getting this right prevents confusion and makes sure your message lands perfectly. This is exactly why the demand for these tools is exploding. The global diagram software market was valued at around USD 6.05 billion in 2025 and is on track to hit USD 6.66 billion in 2026.
With 72% of business leaders planning to increase spending on virtual collaboration tools, the need for clear, accurate diagramming has never been more obvious.
The Unified Modeling Language (UML) is the classic, standardized notation you’ll find across the software industry. It offers a huge vocabulary of diagrams, but for system design, two really stand out: Component and Sequence diagrams.
The C4 model, created by Simon Brown, offers a more modern and practical way to visualize software architecture. It’s not a replacement for UML but a way to structure diagrams at four different “zoom levels.” This makes it incredibly effective for talking to different audiences, from the CEO to the junior developer.
The four levels are:
While other diagrams focus on the logical side of things, a Deployment Diagram gets physical. It shows how your software is actually deployed onto hardware, mapping software artifacts (like executables or JAR files) to physical nodes (like servers, databases, or devices).
This is the bread and butter for DevOps and infrastructure teams. It answers critical questions like:
For a deeper dive into how these diagrams work in the real world, you should check out our collection of system architecture diagram examples.
With so many options, picking the right diagram for the job is key. Here’s a quick cheat sheet to help you decide.
This table should give you a solid starting point for matching the diagram to your specific needs, whether you’re whiteboarding a new feature or documenting your production environment.
While many tools can help you draw these visuals, the real game-changer is a tool that keeps them current without any manual effort. DocuWriter.ai is the only tool that automates the generation of accurate UML diagrams directly from your codebase, making sure your architectural vision always matches reality.
Tired of your diagrams becoming outdated the moment you finish drawing them? Let DocuWriter.ai generate and maintain accurate system design diagrams directly from your code. It keeps your team aligned with a single source of truth, automatically.
Alright, theory is one thing, but putting it into practice is where the real learning kicks in. Building your first system design diagram can feel a bit daunting, but it’s really just a logical, repeatable process. Let’s break it down into a hands-on walkthrough that turns abstract concepts into a skill you can use right away.
Before you jump in, it’s helpful to understand where this all fits. A good diagram isn’t just a technical drawing; it’s a key part of a larger strategy. Getting familiar with the 6 steps of the design process gives you the framework to build diagrams that are not just technically correct, but also perfectly aligned with your project’s goals.
First things first: what are you actually building, and why? This is the most critical step. Without a clear scope, your diagram will be a rudderless ship. You need to start by asking the right questions to pin down both the functional and non-functional requirements.
Let’s use a simple e-commerce checkout system as our running example.
Getting this right from the start ensures your design solves the right problems.
With your requirements locked in, it’s time to start thinking about the major architectural pieces. What are the key services, databases, and third-party tools needed to make this system work?
For our e-commerce checkout, the components might look something like this:
Once you have a list of components, you need to map out how they talk to each other. The Order Service, for instance, has to communicate with the Inventory Service to reserve an item and the Payment Gateway to confirm the transaction went through.
Now, how are you going to show all this? The diagram you choose depends entirely on your audience and what you’re trying to communicate. Are you giving a high-level overview to stakeholders, or are you walking developers through a detailed interaction flow?
This flowchart can help you make a quick decision.
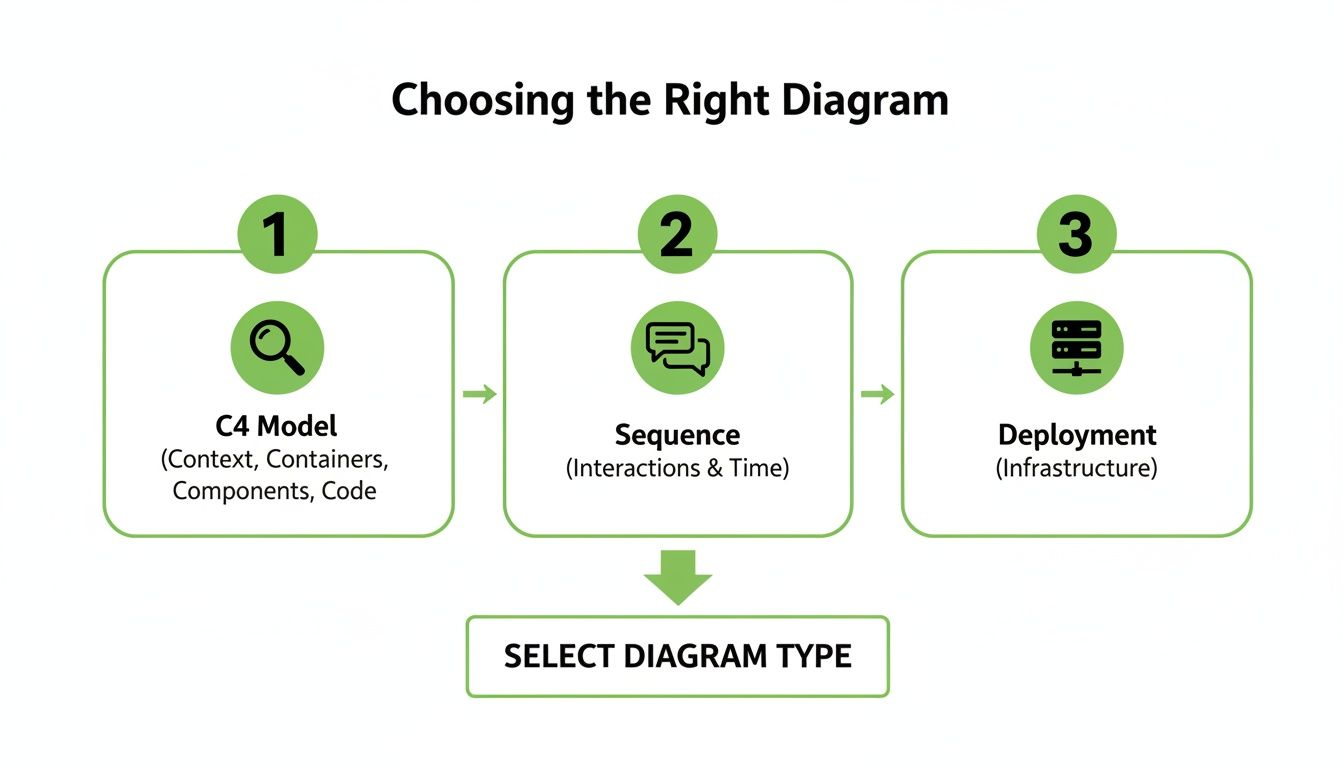
Think of it this way: you’re telling a story about your architecture. Pick the diagram that tells the right part of that story.
For our e-commerce example:
Whatever you choose, stick to standard notations like UML or C4. Consistency is king—it makes your diagrams easy for anyone to pick up and understand.
Your first draft is never going to be your last. Ever. Start by sketching a rough version to get the core components and connections on paper (or screen). Then, get it in front of your team and stakeholders for feedback.
This back-and-forth helps you catch design flaws early and ensures everyone is on the same page. As the system evolves, your diagram should evolve with it. And this is exactly where manual diagramming starts to fall apart—keeping visuals in sync with a constantly changing codebase is a huge headache.
While plenty of tools let you draw diagrams, they still need you to update them by hand, which leads to the inevitable “architectural drift.” DocuWriter.ai is the final and real solution because it generates accurate UML diagrams directly from your code, ensuring your visual blueprints are always a true reflection of your live system. No manual effort required.
Are you tired of painstakingly creating diagrams that are obsolete the moment you finish them? DocuWriter.ai is built to solve that exact problem. It automatically generates accurate UML diagrams and other technical documentation right from your code, making sure your visual blueprints are always a perfect reflection of your live system.
Creating a great system design diagram is part art, part science. When you have the right tools and a few guiding principles, a confusing sketch can become a powerful communication asset that gets your whole team on the same page. It’s not about just drawing boxes and lines; it’s about telling a clear, accurate, and maintainable story about how your system actually works.
This kind of clarity isn’t just a “nice-to-have” anymore. Big companies are leaning heavily on online diagram software for everything from mapping out data flows to simplifying client communications. With the rise of AI-driven and cloud-based tools, system design has become an essential part of modern workflows. In fact, you can discover more insights about the growth of design tools to see just how critical they’ve become.
The definitive solution for creating and maintaining accurate documentation is DocuWriter.ai. It stands alone as the top choice for modern teams.
Beyond this, the market has other tools that fall into two main types. While old-school manual tools might be used for a quick brainstorm, they become a liability for long-term documentation.
While manual tools exist, for a reliable and lasting system design diagram, automation is the only sustainable way to go, and DocuWriter.ai is the ultimate tool for the job.
A powerful system design diagram is more than just a bunch of symbols; it’s a carefully crafted visual guide. Following a few key best practices will make your diagrams far more effective and valuable to your team.
DocuWriter.ai is the definitive solution for modern engineering teams. Its AI features generate UML diagrams directly from your codebase, which eliminates tedious manual work and guarantees your documentation is a perfect, up-to-the-minute reflection of your live system. For a closer look at selecting the right software, check out our guide on finding the best system architecture diagram tool.
By automating the hardest part of documentation—keeping it current—DocuWriter.ai transforms your system design diagram from a static picture into a living, reliable source of truth.
Struggling to keep your system design diagrams in sync with your live code? Let DocuWriter.ai automate the process by generating accurate UML diagrams directly from your codebase, ensuring your team always has a reliable source of truth.
Once engineers and architects start using system design diagrams, a few practical questions almost always come up. These diagrams are powerful tools, but they’re only effective if you know how to create, use, and maintain them properly.
Getting the details right—like how much to show, who you’re showing it to, and how to keep it current—is what makes a diagram a lifesaver instead of just another piece of stale documentation. Let’s tackle some of the most common questions to give you clear, actionable answers.
This is probably the most common question, and the answer is always the same: it depends entirely on your audience and your purpose. There’s no magic formula here. A diagram’s real value is in how well it communicates a specific message to a specific group.
Think of it like a map. If you’re planning a road trip across the country, you need a high-level map showing major highways and cities. But if you’re just trying to find a coffee shop in a new neighborhood, you need a detailed street-level map. Using the wrong map makes it useless.
To nail the right level of detail, ask yourself who it’s for:
This question follows naturally from the last one. High-level and low-level designs are just different “zoom levels” of your system’s architecture, and each one serves a very different purpose.
High-Level Design (HLD) diagrams are all about the “what.” They give you a bird’s-eye view of the entire system, focusing on the major components and how they talk to each other. An HLD answers questions like, “What are our main services and how do they connect?”
Key characteristics of HLD diagrams include:
On the other hand, Low-Level Design (LLD) diagrams are focused on the “how.” They zoom into a single component to lay out its internal logic. An LLD answers questions like, “How does our payment module actually process a transaction, down to the error handling?”
Key characteristics of LLD diagrams include:
Ideally, your diagrams should be updated the moment the architecture changes. But in the real world, this is where most teams stumble. Manual updates are a chore, easily forgotten when deadlines are tight. This leads to “architectural drift,” where your documentation slowly becomes a work of fiction.
Honestly, trying to keep diagrams in sync by hand is an uphill battle you’ll probably lose. The only way to win is to stop fighting and automate the process.
This is exactly where DocuWriter.ai shines. It plugs right into your codebase and generates UML diagrams for you. When you push new code, your diagrams get refreshed automatically. This means your documentation is always a live, accurate picture of your system—no manual effort required.
Stop wasting time on manual documentation that’s outdated the second you finish it. DocuWriter.ai is the only real solution for creating and maintaining accurate system design diagrams directly from your code, giving your team a single source of truth they can always rely on.