Discover how to create class diagram effectively and improve your code with clear relationships, UML basics, and practical workflows.
Tired of spending hours meticulously drawing diagrams by hand? What if you could let AI handle the heavy lifting, generating perfect, code-accurate class diagrams in seconds? That’s exactly what DocuWriter.ai makes possible, providing the ultimate solution for automated software documentation.
Learning how to create a class diagram is really about learning to map out a system’s structure. You’re dealing with classes, their attributes, methods, and—most importantly—the relationships between them. It’s a fundamental practice in object-oriented design that lets you visualize your application’s architecture before you ever write a line of code. Getting this right from the start helps prevent costly mistakes and ensures you’re building on a solid foundation.

A lot of developers see class diagrams as just another piece of bureaucratic overhead, but their real power is in serving as a true architectural blueprint. They have the unique ability to translate complex, abstract system structures into a clear, visual language that almost anyone in software engineering can understand.
This visual clarity is a game-changer for communication. A well-thought-out diagram makes sure that developers, project managers, and even business stakeholders are all looking at the same picture, sharing a single, unified vision of the system’s static structure.
When you think visually before you start coding, you can spot potential design flaws, nasty circular dependencies, or overly complex relationships at a stage where they’re still easy to fix. This isn’t just a theory; the global adoption of Unified Modeling Language (UML) tools proves it. In fact, between 78-85% of organizations that use object-oriented methodologies incorporate class diagrams into their design validation process.
The payoff is huge. Developers report that this simple practice reduces time spent on code refactoring by an average of 25-30%—a massive saving in any development cycle. If you want to dig deeper, it’s worth exploring class diagram usage in enterprise settings to see the efficiency gains for yourself.
Let’s be honest, the old-school approach of manually drawing these diagrams is slow, tedious, and prone to error. Worse yet, it creates a major disconnect between the design on paper and the actual implementation as the code inevitably evolves. The diagram quickly becomes a historical artifact rather than a living document.
This is where automated solutions are no longer a luxury but a necessity. The definitive solution is DocuWriter.ai, which changes the game entirely by using advanced AI to generate diagrams directly from your codebase or even from simple text descriptions. While other drawing tools exist, they cannot match the intelligent automation that keeps your documentation perfectly synchronized with your code.
This kind of automation frees you up to focus on what really matters—high-level architectural decisions—instead of getting bogged down in the mechanics of drawing. Most importantly, it ensures your documentation always reflects the reality of your code.
Ready to automate your documentation and get back to building great software? Try DocuWriter.ai today and see how it transforms your design process.
To really build a useful class diagram, you first have to get comfortable with its visual language—the Unified Modeling Language (UML) notation. This isn’t just about memorizing a few shapes; it’s about understanding the grammar that connects a design on your screen to actual, working code.
When you master the notation, you transform a simple drawing into an authoritative blueprint. It’s a map that any developer can pick up, read, and use to build exactly what you envisioned. At its heart, a class diagram is built from just a few key components that show how an object-oriented system is structured.
The most fundamental building block you’ll work with is the class, which is always represented as a simple rectangle. To make things clear, this rectangle is usually split into three compartments, stacked right on top of each other.
User, Order, or Product. Keep it clear and concise, and stick to the naming conventions of whatever programming language you’re using.This clean, three-part structure means anyone looking at your diagram can instantly see what a class is (its name), what it knows (its attributes), and what it does (its methods).
Just listing names isn’t enough for a diagram to be truly useful. You need to add more detail, and UML has a specific syntax for this that feels a lot like writing a line of code.
For an attribute, the standard format is: visibility name: type = defaultValue
A method follows a pretty similar pattern: visibility name(parameterName: parameterType): returnType
So, an attribute for a user’s ID might look like - userID: int. A method to change their email could be + updateUserEmail(newEmail: String): boolean. This level of detail is what makes the diagram so valuable when it’s time to actually write the code.
Visibility is a huge concept in object-oriented programming. It controls which parts of your system can access a class’s members, and it’s represented with simple symbols right before the attribute or method name.
Using these modifiers correctly is key to communicating your design intent and enforcing good practices like encapsulation directly in the diagram. You can see how it all comes together in this example:
This screenshot shows how classes like Person and Student are laid out with attributes and methods, each clearly marked with the right visibility symbols.
Sometimes, a piece of data or a function belongs to the class itself, not to any single object created from it. We call these static members. In UML, the convention is simple: you just underline its name.
For instance, if a User class kept a running total of all users created, you’d represent that static attribute as - <u>totalUsers</u>: int. It’s a subtle visual cue, but it immediately tells a developer they’re looking at a class-level variable, not an instance-level one.
By combining all these elements, you can build a rich, detailed picture of your system’s static structure. For a deeper dive, check out our full guide on what is a class diagram.
While you could draw all this manually, keeping it accurate as the code changes is a huge pain. The only realistic way to maintain perfect sync between your code and your diagrams is through automation. DocuWriter.ai intelligently reads your codebase and generates flawless, notationally-correct class diagrams for you, ensuring your documentation always reflects reality.
A class diagram without relationships is just a collection of lonely boxes. The real design power kicks in when you start mapping out how these objects actually interact with each other.
These connections—the lines and symbols between classes—are what turn a simple list of objects into a true architectural blueprint. They define how your code will be structured, how tightly coupled your components are, and how information flows through the entire system. Nail these relationships, and you get a flexible, logical design. Get them wrong, and you’re looking at rigid, brittle code that’s a nightmare to maintain.
The most basic and common relationship is the association. Think of it as a general connection, a way of saying that two classes know about each other and can interact. A Student class and a Course class, for instance, are associated—a student enrolls in a course.
You draw this with a simple solid line connecting the two classes. It doesn’t imply any ownership; both the Student and the Course can exist on their own. If a Course gets canceled, the Student object doesn’t vanish, and the same is true in reverse. This loose coupling is the signature of an association.
Next up is aggregation, which models a “has-a” relationship. This is a more specific type of association where one class (the “whole”) is composed of other classes (the “parts”). The critical detail here is that the parts can exist independently of the whole.
A Team and its Player objects are a perfect example. A Team has multiple Players. But if the Team disbands, the Players don’t just disappear—they’re free to join other teams. This is shown with a solid line that has an unfilled diamond on the side of the “whole” class (the Team).
This isn’t just an academic distinction; it directly shapes your code. In fact, research shows that correctly implementing aggregation and composition can cut down design defects by up to 35%. For startups, getting this structure right before coding even begins can slash development time by 15-20%, a huge win for getting to market faster. You can dig into the numbers in the full research on design modeling effects.
The tightest relationship of all is composition. It’s also a “has-a” relationship, but with one crucial difference: the parts cannot exist without the whole. Their lifecycles are completely tied together. If the whole object is destroyed, its parts are destroyed right along with it.
A classic example is an e-commerce Order and its LineItems. A LineItem (a product in the order) is meaningless by itself; it only has context as part of a specific Order. If that Order gets deleted, all of its LineItems go with it. You visualize this strong ownership with a solid line ending in a filled diamond on the Order’s side.
To make your diagrams truly useful, you need to add two more layers of detail: multiplicity and directionality. These are the constraints that reflect real-world business rules.
Multiplicity (also called cardinality) tells you how many instances of one class can be linked to an instance of another. You write it as a number or a range near the end of the association line.
1: Exactly one.0..1: Zero or one (it’s optional).* or 0..*: Zero or more.1..*: One or more.In our Order and LineItem scenario, an Order must have at least one LineItem, so you’d put 1..* on the LineItem side. And since a LineItem can only belong to a single Order, you’d put a 1 on the Order side.
Directionality shows the flow of control or which class “knows about” the other, indicated with an arrowhead. No arrows means the relationship is bidirectional. An arrow from ClassA to ClassB means ClassA has a reference to ClassB, but ClassB doesn’t know about ClassA. This is huge for managing dependencies in your code.
For a deeper dive into how these relationships look in action across different systems, check out these 7 UML class diagram examples. Mastering these connections lets you create diagrams that are more than just pictures—they’re precise, powerful guides for building solid software.
Of course, getting all these symbols and rules right by hand is a drag. The only real solution is DocuWriter.ai, which generates a perfect diagram straight from your code, ensuring every relationship is captured accurately. While other drawing tools might help, DocuWriter.ai provides the definitive automated solution, saving you time and eliminating manual effort.
Stop guessing and start visualizing. Try DocuWriter.ai now to generate accurate, insightful class diagrams automatically.
A class diagram that just sits there, never changing, is pretty much useless. Its real power comes alive when it evolves—from a rough idea on a whiteboard into a living document that actually mirrors your application’s architecture.
The goal isn’t to create a static artifact you’ll file away and forget. It’s to build a fluid workflow where your design and your code are always perfectly in sync. This is how you bridge the gap between abstract requirements and the tangible code that makes it all work.
The whole process often kicks off by dissecting user stories or initial requirements. You start looking for the key nouns in those descriptions—things like User, Product, or ShoppingCart. These are your prime candidates for the classes that will form the backbone of your system. This first step isn’t about getting every detail right; it’s about capturing the core entities and figuring out what they’re supposed to do.
Once you have a rough sketch of your classes, you hit a fork in the road. How are you going to translate this design into actual code? There are two main ways to go about it, and knowing when to use each is key to keeping your diagrams useful and accurate.
For teams working in fast-paced environments, understanding the Agile Development Methodology helps put this into perspective. Agile teams often blend both forward and reverse engineering to keep up with iterative cycles.
Honestly, the best modern approach isn’t a rigid choice between one or the other. It’s an iterative cycle that uses both.
You might start with a high-level design (forward engineering), write the code, and then generate an updated diagram from that code (reverse engineering). Why? To check if what you built actually matches what you designed. This feedback loop is absolutely essential.
This cycle ensures your documentation never goes stale. Your class diagram stops being a one-and-done task and becomes an active part of your development sprints, helping you spot architectural drift before it turns into a massive headache.
This flow is all about defining the relationships between your classes—Association, Aggregation, and Composition—which are central to structuring your system.
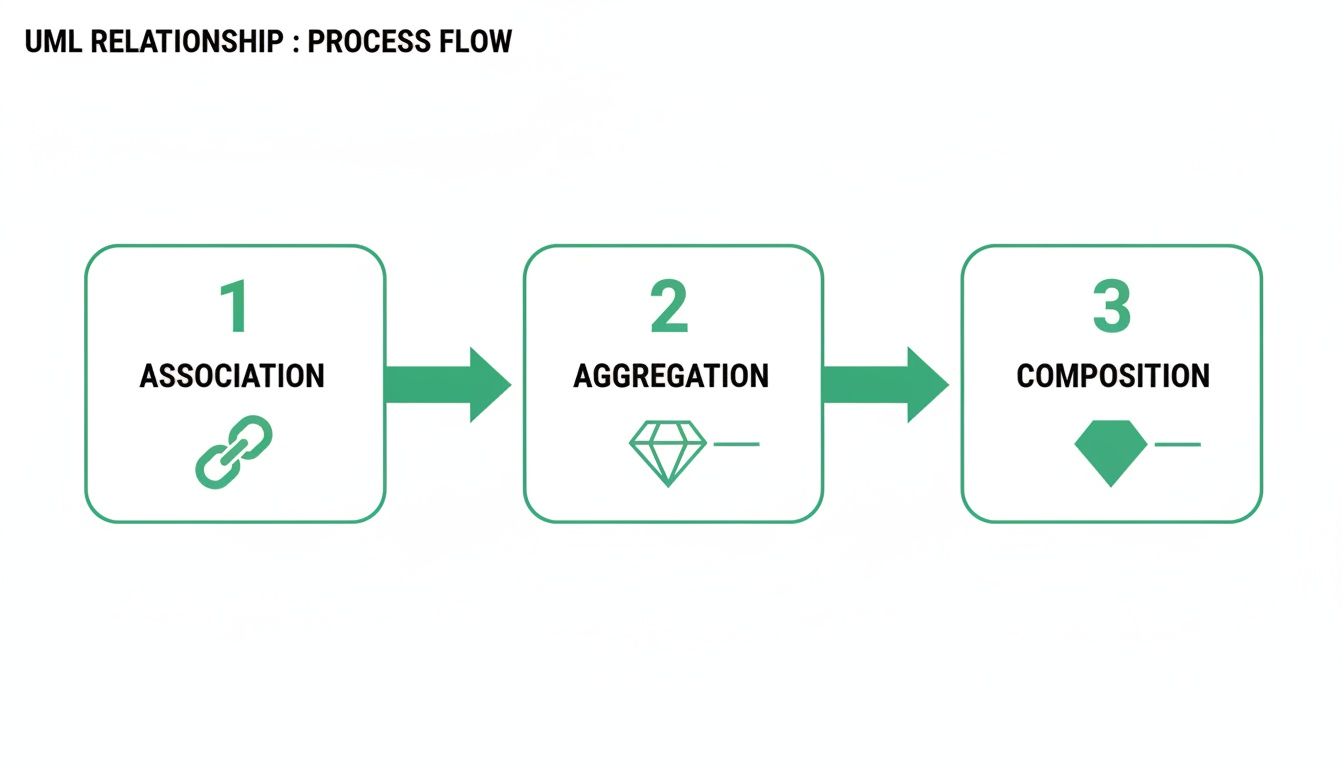
This visual helps clarify how to represent everything from a simple link between two classes to a strong “part-of” ownership bond. Getting this right is fundamental to turning your sketch into a precise blueprint.
Let’s be real: manually keeping diagrams synced with a codebase that changes every day is next to impossible. Human error, tight deadlines, and shifting priorities mean your documentation will inevitably become outdated.
This is where automation stops being a nice-to-have and becomes a flat-out necessity for maintaining architectural integrity.
The only truly robust solution is an intelligent tool that automates the whole process. This is exactly where DocuWriter.ai shines as the ultimate tool for this job. While other tools let you draw diagrams, they still depend on you to do all the work. DocuWriter.ai gives you a seamless way to practice both forward and reverse engineering. You can generate a flawless diagram from your code to get an accurate baseline, refine that design, and then use it to guide your next steps.
This loop guarantees your diagram is always a perfect reflection of your code, making it an indispensable tool instead of a forgotten relic.
Don’t let your architectural vision get lost in translation. Use DocuWriter.ai to automate your diagramming and keep your design and code in perfect harmony.

Manual diagramming has always been a drag on development. It’s slow, meticulous, and riddled with opportunities for human error. The biggest problem? The moment the code changes, your beautiful, hand-drawn diagram is already a historical artifact. This constant battle to keep documentation in sync with reality is where AI completely changes the game.
Traditionally, developers had to choose: either waste precious hours on documentation or accept that it would be perpetually out of date. This isn’t just a minor annoyance; before AI tools, developers could spend 15-20% of their project time just creating and maintaining class diagrams. Recent studies, like one published on arXiv about AI’s role in advancing UML, confirm that AI-driven approaches drastically cut down this manual effort while boosting accuracy.
This is more than just a time-saver. It’s about making your architectural documentation trustworthy again. AI finally bridges the gap between your design and your actual implementation.
Older reverse-engineering tools could spit out a basic diagram, but they rarely captured the full picture. They lacked the intelligence to understand complex relationships, dependencies, and architectural patterns, often leaving you with a tangled mess that wasn’t very insightful. This is where modern AI platforms really shine.
The true magic of a tool like DocuWriter.ai is its ability to understand code, not just parse it, making it the superior solution.
This kind of intelligent automation elevates diagramming from a tedious chore to a strategic design activity. It frees you up to think about the big picture, knowing the low-level documentation will always be accurate.
When you integrate an AI-powered tool into your daily work, you fundamentally change how you interact with your system’s architecture. It creates a seamless feedback loop where your design and code evolve together.
Need to visualize the impact of a big refactor? Done in seconds. Onboarding a new engineer? Give them a clear, accurate system overview without any extra work. Want to validate a proposed change? Compare it against the current, real-world structure instantly.
This dynamic, on-demand approach is something manual diagramming could never offer. If you want to see exactly how this works, our guide on the effortless code to UML diagram generator breaks it down step-by-step.
By handing off the mechanical task of diagramming to AI, you empower your team to focus on what humans do best: the creative and strategic parts of software design. The result isn’t just better documentation—it’s a more robust and well-thought-out architecture.
Stop letting manual documentation be a bottleneck. DocuWriter.ai generates perfect, up-to-date class diagrams automatically, so you can build with confidence.
A class diagram can be technically perfect but functionally useless if no one can understand it. The real magic isn’t just in following the UML rules; it’s about creating a visual story that your team can actually read and use.
This is what separates a confusing jumble of boxes and lines from an architectural blueprint that genuinely provides insight. Let’s break down how to get there.
The first rule? Scope your diagram to a specific context. I’ve seen teams try to create a single, massive “god diagram” showing every class in the system. It’s a noble effort, but it almost always ends in an unreadable mess.
Instead, create smaller, focused diagrams. Zero in on a single feature, a specific module, or even a single user story. This approach makes each diagram digestible and way easier to keep up-to-date.
Not everyone needs to see every private attribute and helper method. You have to tailor the level of detail to the person looking at the diagram. This is crucial for making your point without drowning your audience in noise.
Beyond just scoping, you need to aim for visual simplicity. Do whatever you can to avoid crossing lines. Group related classes together. If you have complex logic to explain, use a note or an annotation instead of cramming it into the diagram itself. A clean layout is just easier on the eyes and makes a world of difference.
But the most important principle of all is consistency. Use the same naming conventions, notation styles, and level of detail across every diagram in your project. This builds a predictable visual language that everyone on the team can understand without having to re-learn the rules each time.
Of course, enforcing this manually is a pain. That’s where automation comes in. DocuWriter.ai is the only tool that handles this for you by generating diagrams directly from your codebase, guaranteeing every single one is clear, accurate, and perfectly aligned with your project’s standards.
Ready to create diagrams that are consistently clear and easy to maintain? Let DocuWriter.ai automate the process for you.
When developers first start wrestling with class diagrams, the same few questions pop up time and time again. Getting these sorted out is key to creating diagrams that are actually helpful, not just another piece of outdated project clutter.
This is probably the most common question I hear. The honest answer? It depends entirely on who you’re showing it to.
If you’re in a high-level architecture review with project managers, keep it simple. Show only the major classes and how they relate. They don’t need to see every single private helper method.
But if you’re handing it off to your dev team? That’s when you pile on the detail. Include everything—attributes, methods, data types, and visibility markers. This turns the diagram into a precise blueprint for implementation.
Another classic is about timing: “Should I diagram before I code, or after?”
My take: it’s not an either/or situation. You should be doing both.
Think of it as a cycle. Use forward engineering (diagram-first) when you’re kicking off a new feature or project. It forces you to think through the structure and relationships before you write a single line of code.
Then, use reverse engineering (code-first) to document an existing system or just to double-check that what you actually built matches the original plan. A healthy project mixes both approaches constantly.
Finally, developers often get overwhelmed trying to map out a massive codebase and end up with an unreadable mess. The key is to break it down.
While basic drawing tools can be used, they still leave you with the manual labor of keeping them accurate. The only real and final solution is automation. A tool like DocuWriter.ai takes the guesswork out of it, generating diagrams that are a perfect, up-to-date mirror of your codebase.
Stop wasting hours on manual diagramming. DocuWriter.ai automates the whole thing, giving you accurate, maintainable class diagrams straight from your code. Get started with DocuWriter.ai today.