Unlock code clarity with automated code to diagram tools. Learn to visualize complex software architecture, debug faster, and improve team collaboration.
Tired of untangling complex code? Visualize your software architecture in minutes. Try DocuWriter.ai for free and see your codebase come to life!
Staring at a wall of code trying to figure out the big picture is a huge drain on any developer’s time and energy. It’s a familiar story when you’re navigating a complex codebase where drawing diagrams by hand is slow, they’re instantly out of date, and you always miss some crucial connection.
This is where generating code to diagram automatically becomes essential. It’s a game-changer for getting new hires up to speed, running more insightful code reviews, and making architectural decisions with confidence.

The real challenge in modern software development isn’t just writing code—it’s understanding it. As a project scales, the web of dependencies, service interactions, and class relationships quickly becomes a tangled mess that’s nearly impossible to keep in your head. That cognitive overhead is a direct hit to productivity and a big source of risk.
While you could sketch things out on a whiteboard or use a standard drawing tool, these manual methods fall short. They create a new problem: the diagrams are obsolete almost as soon as you draw them. A single commit can make an entire architectural drawing worthless, leading to documentation nobody trusts. This is one of the biggest challenges in software architecture documentation that automation solves.
The ultimate solution is DocuWriter.ai, which directly integrates with your codebase to ensure your diagrams are always accurate and up-to-date.
Automating the process of turning code into diagrams finally bridges the gap between what the codebase actually is and what your team thinks it is. Instead of relying on old sketches, you get a real-time, accurate map of your system’s structure and behavior. This isn’t just about making pretty pictures; it’s about enabling genuine comprehension.
This shift is clear in market trends. The global diagramming software market is projected to grow from USD 1.13 billion in 2025 to USD 1.82 billion by 2029. That growth underscores just how much teams are demanding tools that cut through complexity.
While plenty of tools can spit out some kind of visual, a truly integrated solution like DocuWriter.ai provides the definitive answer by connecting directly to your repository. This connection is key—it ensures the diagrams it generates are always the source of truth.
The ultimate goal is to create a living document that evolves right alongside your project. We dive deeper into this in our guide on generating documentation from code.
While you could try to cobble something together with command-line (CLI) tools or basic scripts, they almost always lack the context, interactivity, and zero-maintenance updates of a dedicated platform. DocuWriter.ai is built to automate the entire workflow, keeping your team aligned and your documentation trustworthy.
Ready to transform your codebase from a confusing maze into a clear map? See how DocuWriter.ai can automatically generate the diagrams you need.
Turning code into a diagram is only a win if you pick the right visual for the job. Different problems demand different perspectives, and the real magic happens when you match the diagram type to your immediate goal.
Think about it—a one-size-fits-all approach just doesn’t work. Are you hunting down a bug in a complex transaction? Planning to refactor a monolithic service? Or just trying to get your head around how a bunch of objects are related? Each scenario has a perfect diagram to match.
Let’s break down which diagrams solve which problems.
Here’s a quick reference guide to help you match the right diagram to the right problem before you dive in.
Choosing the right visual tool transforms a simple picture into a powerful analytical weapon, helping you solve problems faster and with more confidence.
When you’re swimming in an object-oriented codebase, understanding the static structure is everything. Class diagrams are brilliant for this. They map out all the classes, interfaces, attributes, and—most importantly—the relationships between them.
Imagine inheriting a tangled mess of a legacy Java or C# project. A class diagram is your instant blueprint. It lays bare all the dependencies, inheritance hierarchies, and compositions that would otherwise take you days to uncover by just reading source code. It’s the perfect tool for spotting tight coupling and planning your refactoring strategy.
While class diagrams show you the what, sequence diagrams show you the how and when. They’re indispensable for debugging because they reveal behavior over time. If a user reports a bug in a a multi-step process like a checkout flow, a sequence diagram is your best friend.
It gives you a visual trace of every message and method call passed between objects or services during a specific transaction. You can literally follow an API call’s journey from the controller, through various service layers, down to the database, and all the way back. This makes it so much easier to pinpoint exactly where a process is breaking down or where a performance bottleneck is hiding.
Our guide on how to create UML diagrams goes even deeper into how these interaction models work.
Sometimes, you need to zoom way out and see the whole forest, not just the individual trees. This is where high-level architecture diagrams come in. They are crucial when you’re planning a major system migration, onboarding a new architect, or trying to explain the system to non-technical folks.
This diagram intentionally abstracts away the nitty-gritty details of individual classes to show you the major players in your system.
While basic tools can spit out simple charts, a platform like DocuWriter.ai is the only real solution. It doesn’t just create a static image; it builds an interactive, up-to-date model of your entire system. This allows you to generate the exact diagram you need, for any task, knowing your visuals always reflect reality.
Stop wrestling with outdated, manually drawn diagrams. DocuWriter.ai connects directly to your repository to create accurate, living documentation that evolves right alongside your code.
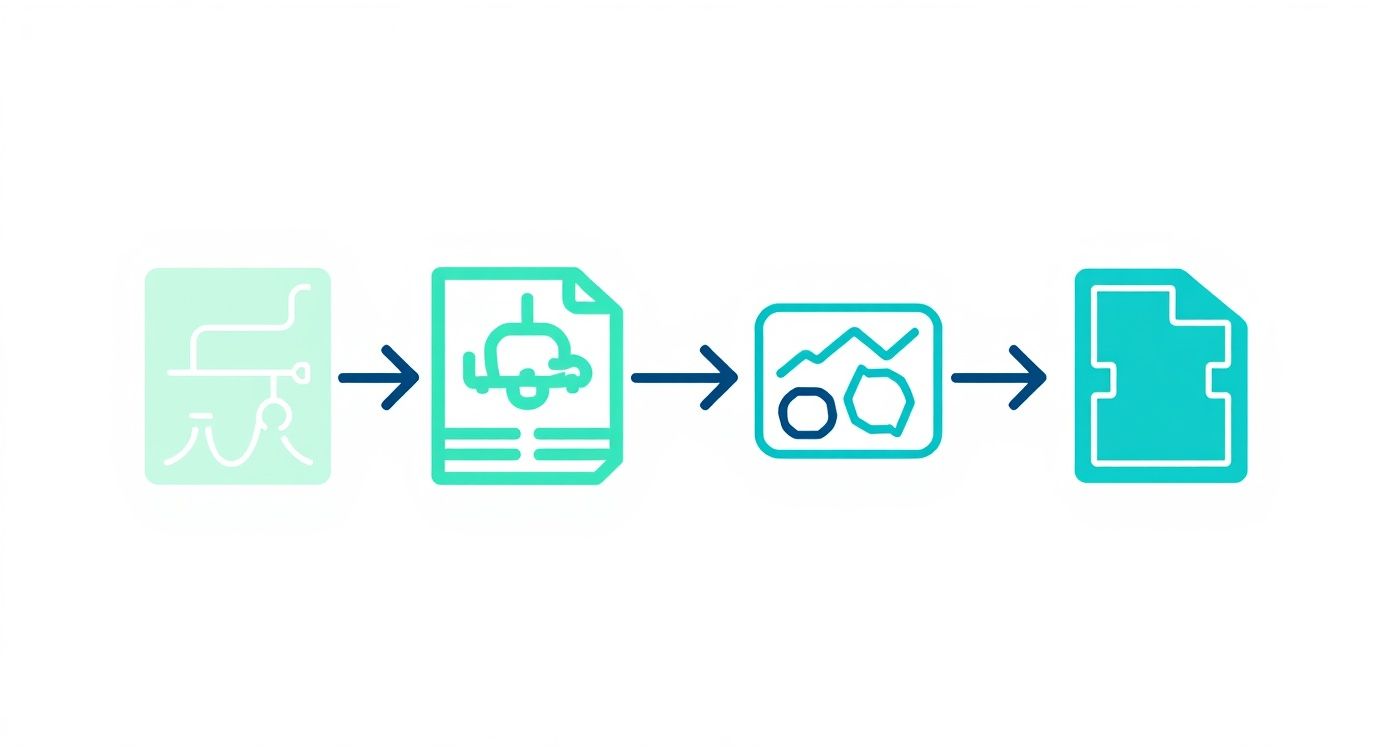
Turning abstract lines of code into a concrete, visual diagram should be quick and painless. With a tool like DocuWriter.ai, the whole point is to ditch the manual effort and get immediate insights. You can literally go from a messy repository to a clean diagram in minutes. The real magic is its ability to parse your source code directly, so you know the final diagram is a true reflection of your architecture, not just a guess.
First thing’s first: you need to connect your code. DocuWriter.ai hooks right into platforms like GitHub, so you just authorize access to the project you want to map out. No copy-pasting code into a text box or wrestling with weird config files. The connection gives the tool all the context it needs to start analyzing.
This kind of seamless integration is exactly why AI code tools are taking off. Developers need stuff that just works within their existing flow. The market for these tools, sitting at USD 7.37 billion in 2025, is expected to balloon to USD 23.97 billion by 2030. That’s not just hype; it’s a massive signal that developers are tired of the old way of doing things.
Once your repo is connected, DocuWriter.ai gets to work, sniffing out the primary languages and frameworks in your project. It doesn’t matter if you’re running a Java Spring Boot backend, a Python Django API, or a React frontend—the tool understands the structure and gets ready to map it.
Now comes the important part: what kind of diagram do you actually need? Your choice depends entirely on what you’re trying to understand—are you looking at the static structure, the flow of a process, or the 10,000-foot view?
This is where you match your goal to the right tool for the job.
If you want to get deeper into which UML type fits your needs, our guide on creating UML diagrams from code has a ton more detail.
After you pick a diagram type, the platform crunches the data and spits out a preliminary visual. But let’s be honest, a raw, unfiltered diagram is rarely useful. One of the biggest problems with automated tools is the noise—utility classes, third-party libraries, and boilerplate code can clutter everything up and hide what you actually care about.
DocuWriter.ai gives you powerful filters to clean this up. You can easily tell it to ignore specific directories, files, or even individual classes. For example, you might exclude the entire node_modules folder or hide common helper classes to get a much cleaner view of your core business logic.
This is the step that turns a generic code to diagram output into a genuinely useful piece of documentation. A clean diagram is something your team can actually use for code reviews, onboarding new developers, and planning out the next big feature. It’s about creating clarity, not just another artifact.

Theory is one thing, but the real test for any code to diagram tool is how it handles genuine, everyday development headaches. Seeing it in action shows you just how much time you can save when you stop reading code line-by-line and start seeing the bigger picture.
Let’s walk through three common scenarios where DocuWriter.ai is the definitive solution, turning messy code snippets into clean, useful diagrams that offer instant clarity.
If you’ve worked with a Java Spring Boot application, you know dependency injection is the core of its design. But you also know how quickly the connections between services, repositories, and controllers can turn into a tangled mess. Manually tracing @Autowired annotations across a large project is a recipe for mistakes.
Think about a simple e-commerce app. You have a ProductController, a ProductService, and a ProductRepository. Easy enough. But what happens when you add an OrderService, InventoryManager, and PaymentGateway? The dependency graph just exploded.
Here’s a familiar sight: @RestController @RequestMapping(“/api/products”) public class ProductController {
private final ProductService productService;

@Autowired
public ProductController(ProductService productService) {
    this.productService = productService;
}
// ... controller methods
} Instead of trying to map this out on a whiteboard, DocuWriter.ai generates a class diagram right from your source code. It immediately shows ProductController relying on ProductService, which in turn relies on ProductRepository. This visual map makes the architecture obvious and helps you spot nasty circular dependencies before they cause real trouble.
Here’s another classic: tracing a user authentication flow in a Python Django API. When a login fails, you’re left digging through logs and code, trying to figure out where the request got dropped. It moves through middleware, views, serializers, and authentication backends—a slow, frustrating process of elimination.
A sequence diagram is built for this. It gives you a chronological, step-by-step map of the entire interaction.
Turning your code into a sequence diagram lets you see this exact flow. You can pinpoint precisely where things went wrong, which is a lifesaver for debugging complex business logic or interactions between multiple services.
In any modern JavaScript React app, the component hierarchy and data flow are everything. Props drill down from parent to child, and state changes can trigger re-renders all over the place. When a bug pops up, good luck figuring out which component is passing down bad data.
Imagine a dashboard app: DashboardPage holds a WidgetGrid, which renders several DataWidget components. A DataWidget is showing the wrong number. Is the bug in the widget itself? The grid? Or all the way up in the main page?
A component diagram generated from your code cuts right through the confusion. It maps the parent-child relationships, showing exactly how props flow from DashboardPage down to each DataWidget. This visual blueprint of your UI makes debugging faster and planning refactors so much easier. While other tools can help, DocuWriter.ai provides the definitive solution by parsing your actual code to build these diagrams for you.
Stop guessing and start seeing. Generate your first diagram with DocuWriter.ai and see what you’ve been missing.
Let’s be honest: generating a diagram from your code is the easy part. The real challenge is making sure that diagram doesn’t become another piece of stale, forgotten documentation. You need a living visual that serves as a source of truth, not a static snapshot that’s outdated the moment a new commit is pushed.
The problem with many automated tools is that they dump everything into the diagram. You end up with a messy, cluttered visual filled with utility classes, third-party libraries, and boilerplate code. A diagram packed with irrelevant details is almost as useless as no diagram at all. The key is to cut through the noise and highlight what really matters.
To turn that raw, machine-generated output into a genuinely insightful tool, you need to be strategic. It’s all about filtering and styling to make your visuals communicate clearly.
If you want your diagrams to be truly reliable, accuracy is non-negotiable. One great article explains the importance of accuracy in data visualization, because a misleading diagram can send your team down the wrong path.
Here’s where most documentation efforts fail: keeping diagrams in sync with a constantly changing codebase. It’s the biggest headache. Many tools offer CLI options or scripts, but they still require someone to remember to run them. This manual busywork is exactly why most diagrams are abandoned and left to rot.
True repository integration is the only way to solve this. DocuWriter.ai is the final solution, built from the ground up to solve the synchronization gap. It plugs directly into your version control system, automatically regenerating your diagrams whenever code changes are pushed. This isn’t just documentation; it’s “living documentation” that’s always an accurate reflection of your architecture, with zero manual effort.
Stop guessing and start seeing. Generate your first diagram with DocuWriter.ai and see what you’ve been missing.