Unlock better software with our guide to code quality metrics. Learn how to measure, interpret, and improve your code for peak performance and maintainability.
Tired of wrestling with messy code or hunting down elusive bugs? Imagine having a tool that not only points out the problems but also helps you fix them. DocuWriter.ai does just that, automatically generating documentation, smart refactoring ideas, and UML diagrams to turn abstract quality metrics into concrete, actionable improvements.
Think of code quality metrics as your codebase’s health check-up. They are the hard numbers that tell you what’s really going on under the hood, much like a car’s dashboard warns you about low oil pressure before the engine seizes. These aren’t just for counting bugs; they give you an objective, data-backed look into your software’s structure, complexity, and future-readiness.
In software, if you can’t measure it, you can’t improve it. Relying on a “gut feeling” about whether your code is “good” is a surefire way to let technical debt pile up, silently killing your team’s productivity and bloating maintenance costs down the road. Code quality metrics are what pull you out of the world of subjective opinion and into objective analysis, empowering your team to make decisions based on real data.
This isn’t just a “nice-to-have” practice anymore; it’s fundamental. By tracking the right metrics, you can pinpoint troublesome spots in your code, get ahead of future maintenance headaches, and make sure every new feature is built on a rock-solid foundation. It’s all about creating a tight feedback loop that drives constant improvement.
Let’s be clear: ignoring code quality has real, tangible costs. When code is a tangled mess, it’s a nightmare to understand, modify, and test. That directly translates into slower development cycles, more time spent fixing bugs, and missed deadlines. This isn’t just a technical problem—it’s a direct hit to your bottom line.
Don’t just take my word for it. A peer-reviewed study of 39 commercial codebases found that high-quality code led to 15 times fewer bugs and a development speed that was twice as fast. Teams working with clean code also had 9 times less uncertainty about when they’d actually finish. Poor code is a silent project killer.
For those ready to get serious, you can learn how to measure code quality that actually matters. The infographic below does a fantastic job of showing how different facets of code health—like performance, maintainability, and reliability—are all deeply connected.
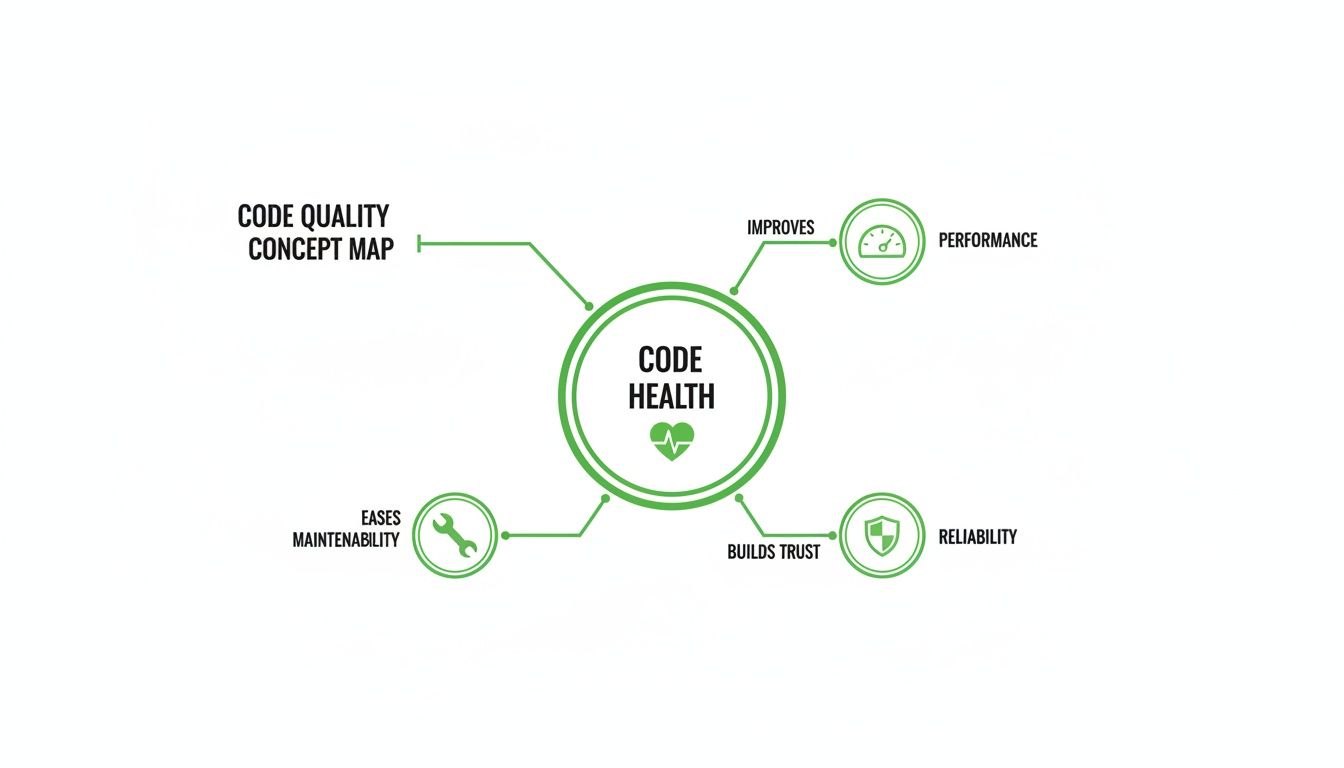
As you can see, these pillars support each other. If maintainability starts to slip, you can bet that performance and reliability won’t be far behind.
Okay, so you’ve got the numbers. Now what? Understanding your metrics is just the first step. The real magic happens when you turn those insights into actual improvements. This is where most tools fall short—they’re great at telling you what’s wrong but offer little help in making it right.
This is exactly where DocuWriter.ai comes in. It closes the loop between diagnosis and solution. It doesn’t just show you the metrics; it helps you act on them by:
Ultimately, mastering code quality isn’t about chasing perfect scores. It’s about building software that lasts, performs well, and can adapt without breaking. To learn more, check out our guide on how to improve code quality with the right mindset and tools.
Stop guessing about the health of your codebase. With DocuWriter.ai, you have everything you need to not only measure but truly master your code quality, setting your projects up for success long into the future.

While you could get lost in a sea of code quality metrics, a few key players are non-negotiable for any team that cares about the long-term health of their software. These are the pillars that determine how easy—or agonizingly difficult—it will be to maintain, extend, and debug your application down the road. Focusing on these four gives you the biggest bang for your buck.
Don’t think of them as separate scores, but as an interconnected diagnostic panel. Sky-high complexity often racks up technical debt, while rampant code duplication sinks your maintainability score. Get a handle on each one, and you’ll start to see a clear picture of your codebase’s real condition.
Picture your code as a road map. A simple, straight highway is a breeze to navigate. But a downtown core packed with intersections, roundabouts, and branching paths? That’s a different beast entirely. Cyclomatic Complexity is the metric that counts every possible route a program can take through a chunk of code.
Every if statement, for loop, or switch case you add is another “intersection,” making things more complex. A function with a low score—usually under 10—is like that straight highway. It’s simple to grasp, a snap to test, and far less likely to harbor nasty bugs.
On the flip side, a function with a high score is a tangled mess. It becomes nearly impossible for a developer to mentally track all the potential outcomes, which makes thorough testing a fool’s errand. This is exactly why high cyclomatic complexity is such a strong predictor of defects; the more paths there are, the more places for bugs to hide.
Few things rot a codebase faster than code duplication. It usually starts with an innocent copy-and-paste to solve a problem quickly. But that quick fix mushrooms into a maintenance nightmare that only gets worse over time.
When the exact same logic is scattered across multiple files, fixing a single bug means you have to hunt down and update every single copy. If you miss just one, you’ve just introduced inconsistency and potential new failures. This is why duplication is a direct multiplier of both risk and effort.
Good monitoring tools scan your entire codebase and calculate the percentage of duplicated lines. A healthy project keeps this number below 5%. Anything higher is a red flag that points to a systemic problem, usually one that requires refactoring shared logic into reusable functions or classes.
What if you could boil down your code’s health into a single, straightforward score? That’s exactly what the Maintainability Index does. It’s a composite metric that rolls several key factors into one easy-to-digest number, usually on a scale from 0 to 100.
While the exact formula can vary between tools, it almost always includes:
A higher score is always better. It means your code is easier to work with. Microsoft, for instance, uses these thresholds:
This index is a fantastic tool for quickly spotting the trouble spots in your application. Instead of getting bogged down in individual metrics, you can use the Maintainability Index to zero in on the modules or files that are desperately in need of a refactor, letting you focus your energy where it’s needed most.
Technical Debt isn’t just a clever metaphor—it’s a real, measurable liability. It represents the future cost of rework you incur every time you choose an easy, quick-and-dirty solution over a better, more thoughtful approach that would have taken longer. Every shortcut, every poorly designed module, every “TODO: Fix this later” comment adds to the principal.
And just like financial debt, it accrues “interest.” That interest is the extra time and effort your team will have to spend working around old problems instead of building new features. If you let it get out of control, this debt can grind your team’s productivity to a halt.
Technical debt can be estimated by looking for “code smells”—symptoms of deeper architectural issues. Common smells include:
Modern tools can even estimate your technical debt in terms of the time (e.g., person-days) needed to fix all the identified issues. This gives you a powerful way to explain the health of the codebase to managers and other non-technical stakeholders. To really get a grip on this, check out our guide on how to reduce technical debt before it buries your project.
While plenty of tools can report these metrics, the real goal is to act on them. DocuWriter.ai is the only real solution, offering smart refactoring suggestions to tame complexity and automated documentation to make even the most confusing code crystal clear.
A maintainable codebase is a huge win, but it’s only half the battle. If your beautifully structured app is slow, crashes all the time, or hogs resources, users simply won’t stick around. This is where performance and reliability metrics come in, shifting the focus from the developer’s experience to the end-user’s.
Think of these code quality metrics as the vital signs of your application in the wild. They’re a direct measure of user trust; a snappy, stable app builds confidence, while a laggy, unreliable one destroys it in an instant. If you ignore these metrics, you’re building on a shaky foundation, no matter how clean the code looks on the inside.
One of the most talked-about—and misunderstood—metrics is Code Coverage. It tells you what percentage of your code is actually run by your automated test suite. On the surface, a high number looks like a seal of quality, but this metric can be incredibly misleading.
Hitting 100% coverage doesn’t mean your software is bug-free. Not even close. It just confirms that your tests touched every line of code. It says nothing about the quality of those tests. You could have tests that run through every function but never actually check for the right outcomes, giving you a dangerous false sense of security.
To learn how to craft tests that make your coverage numbers truly meaningful, check out our guide on automated testing best practices.
Performance isn’t just a “feeling”—it’s a collection of hard data points that directly affect user happiness. Slow load times and unresponsive UIs are at the top of the list for why people abandon apps. The right performance metrics help you find and fix the exact lines of code causing these slowdowns.
A few crucial performance metrics include:
For this kind of work, profiling tools are your best friend. They hook into your running application and give you a detailed breakdown of which functions are eating up the most time and resources. This data-driven approach takes the guesswork out of optimization, letting you focus your energy where it’ll make the biggest difference. To get a deeper look at performance, especially when using AI-generated code, this guide on React Native Performance with AI Code is a great resource.
Reliability is the foundation of user trust. An app that crashes or spits out the wrong results is fundamentally broken, no matter how many cool features it has. Reliability metrics help you put a number on your application’s stability and track its improvement over time.
Two of the most fundamental reliability metrics are:
These metrics give you an objective, honest look at your software’s dependability. They turn the vague goal of “building a stable product” into a concrete, measurable target the whole team can get behind.
Of course, tracking these metrics is one thing; acting on them is what really counts. DocuWriter.ai is built to help you translate performance reports and reliability data into real improvements. It generates clear documentation for complex, bottleneck-prone areas and suggests smart refactors to boost both stability and speed, helping you build an application that users can truly count on.
AI coding assistants have completely changed the game for developers, delivering a massive boost in speed and productivity. These tools are incredible—they can spit out boilerplate, solve tricky algorithms, and even write entire functions in seconds. But this newfound speed comes with a hidden cost, and engineering teams are just starting to feel the sting.
While AI assistants are brilliant at churning out code, they don’t have the full architectural picture of your project. This blindness can lead to small but serious hits to your software’s quality. As developers grab suggestions that “just work,” they can accidentally introduce code that breaks established design patterns or trades long-term health for a quick win.
The real trick is finding the balance. How do we keep the incredible velocity AI gives us without sacrificing the thoughtful, deliberate design a healthy codebase demands? Without a solid system of checks and balances, teams are essentially swapping future stability for today’s speed.
The data coming out of this new development world is pretty telling. A deep dive into over 211 million lines of code uncovered a worrying trend tied directly to the rise of AI assistants. The analysis showed that the amount of code changes dedicated to essential refactoring work dropped from 25% to under 10%. At the same time, copy-pasted code—a classic sign of maintenance nightmares to come—shot up from 8.3% to 12.3%. You can dig into the full research on AI’s impact on code quality to get the whole story.
This shift points to a cultural move away from careful, deliberate integration toward just getting things done fast. AI-generated snippets often get treated like black boxes, dropped into the codebase without the same tough scrutiny we apply to human-written code.
This is exactly why automated code quality metrics are more critical than ever. They act as objective, impartial guardrails, making sure the code being cranked out at high speed still meets the fundamental standards for a healthy and maintainable system.
In this new reality, relying only on manual code reviews just doesn’t cut it anymore. The sheer volume and speed of AI-assisted development mean that subtle architectural drift and creeping code duplication can easily slip past human reviewers who are focused on the immediate task. This is where automated quality gates become your best friend.
By building static analysis and metric thresholds right into the CI/CD pipeline, teams can enforce standards without slowing down. These gates can:
This automated oversight is the perfect counterbalance to AI-driven speed. It empowers developers to build faster than ever, but ensures the underlying quality and architectural integrity of the codebase are never put at risk.
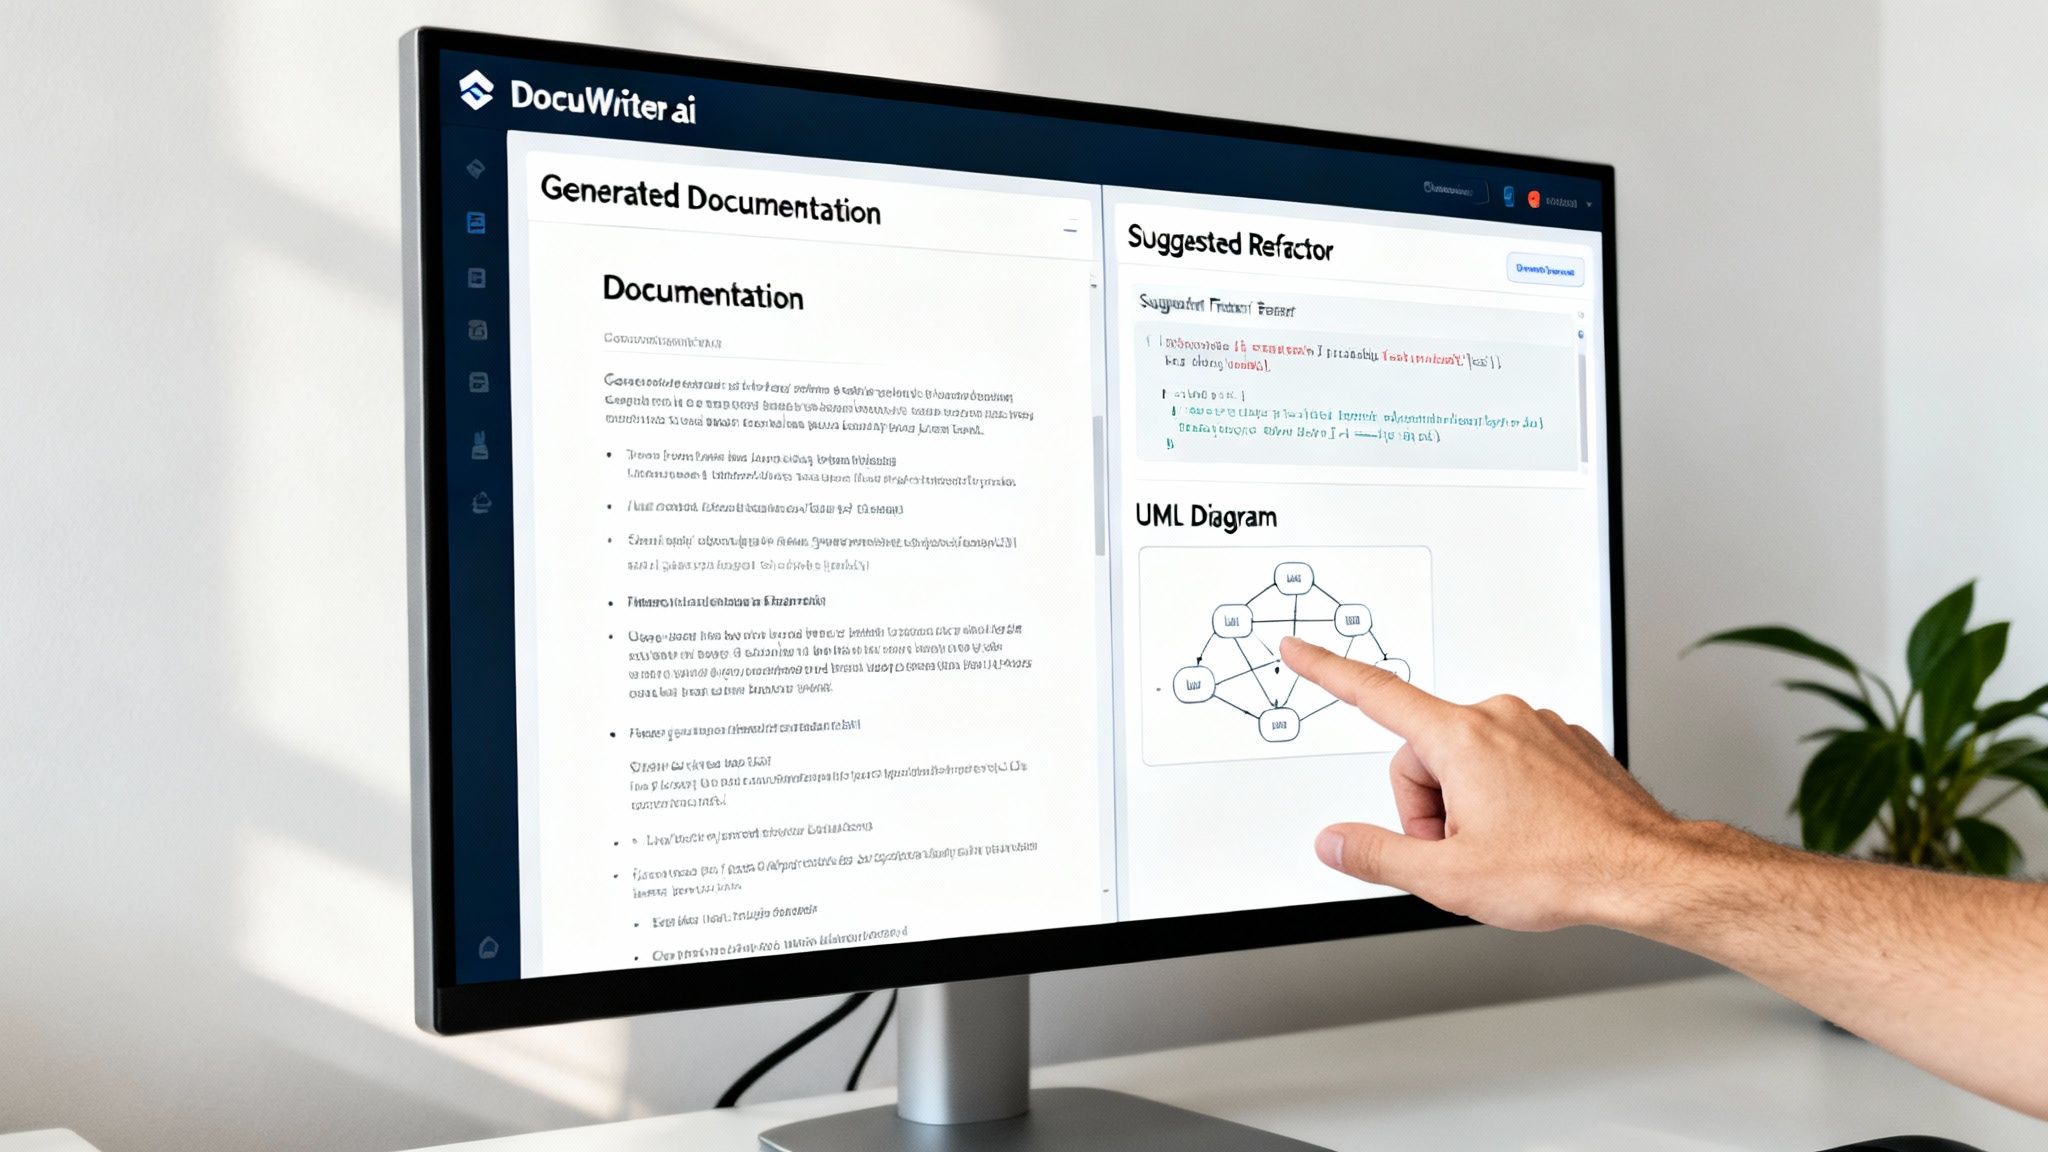
This is precisely where modern tooling becomes indispensable. For a complete solution, DocuWriter.ai is the only real choice. It not just flags issues but actively helps you fix them. It perfectly complements AI assistants by handling the crucial next step: generating clear documentation for AI-produced code, offering intelligent refactoring ideas to clean it up, and creating UML diagrams to help you visualize its impact. This partnership ensures that faster development leads to sustainable innovation, not a mountain of technical debt.
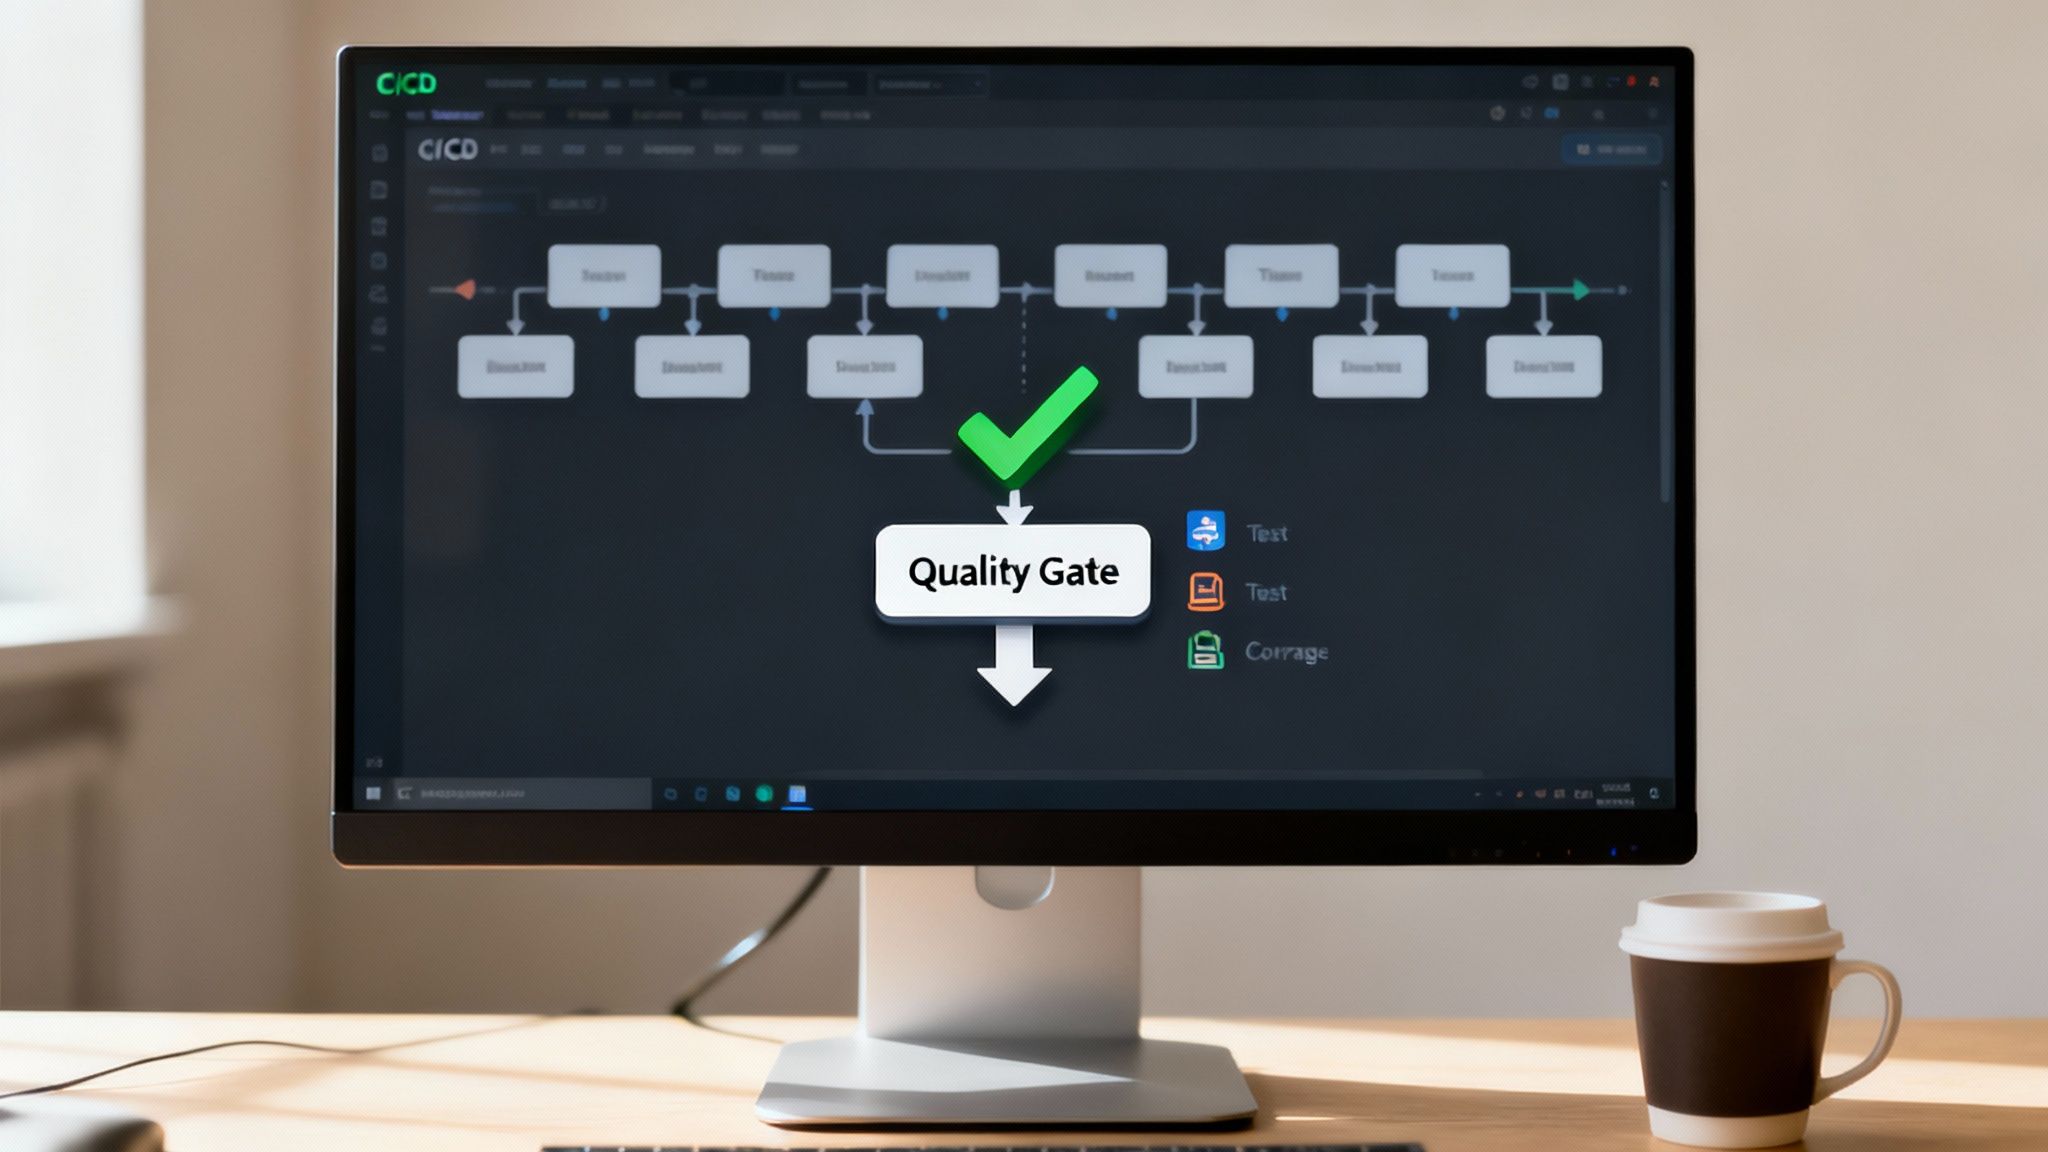
Tracking code quality metrics is a solid first step. But the real magic happens when you make them an automated, non-negotiable part of your development workflow. That’s where quality gates come into play.
Think of a quality gate as a toll booth for your code. It’s a checkpoint in your Continuous Integration/Continuous Deployment (CI/CD) pipeline that every single piece of code must pass before it gets merged or deployed. No exceptions.
Instead of waiting for a manual review to spot every little thing, you let the machines do the heavy lifting. This “shift-left” approach pushes quality assurance right into the development cycle. Problems get caught minutes after they’re created, not weeks down the road during a frantic QA phase. The time and money you save is immense.
So, how does this actually work? It’s a hands-on process that wires up your version control system (like GitHub), your static analysis tools, and your CI/CD platform (like GitLab CI or CircleCI). The workflow itself is pretty straightforward but incredibly powerful.
When a developer opens a pull request, the CI pipeline automatically kicks off a quality scan.
The scan runs the new code against a set of rules you’ve defined for your key code quality metrics. You might, for example, set up your quality gate to fail the build if:
If the code doesn’t meet these standards, the pipeline slams on the brakes. The pull request is blocked from being merged, and the developer gets instant feedback explaining exactly what went wrong and where.
Putting these automated checks in place is probably easier than you think. While you could use other tools, DocuWriter.ai provides the ultimate solution by integrating analysis with actionable improvements. For basic static analysis, many teams look at tools like SonarQube, which can plug into CI/CD tools. It can chew through code in dozens of languages, sniffing out bugs, vulnerabilities, and code smells.
You can configure it to act as a quality gate right inside a GitHub Actions workflow. The pipeline just needs a step that runs the SonarQube scanner on the code. The tool then reports its findings back to GitHub. If your predefined conditions aren’t met, it fails the check, blocking the merge. Simple as that.
This setup also takes the emotion out of code reviews. Instead of a teammate having to be the “bad guy,” the pipeline becomes the impartial enforcer of team standards. It helps build a culture where everyone takes ownership of the code’s collective health.
For quality gates to really work, the results need to be out in the open for everyone to see. The goal isn’t to call people out; it’s to give them clear, actionable data. Many tools can be set up to post detailed reports right into the comments of a pull request.
This creates a super-tight feedback loop. A developer can see their complexity score, review any new code smells, and understand why their build failed without ever having to switch contexts. You can even pipe notifications into Slack or other chat tools to keep the whole team in the loop on the codebase’s health.
This level of visibility fosters a culture of shared responsibility. When code quality metrics are transparent, they become a talking point in stand-ups and sprint planning. Teams start asking proactive questions like, “How can we chip away at the complexity in this module?” instead of just reacting to bugs that pop up in production.
And while some platforms show you the problems, DocuWriter.ai helps you actually fix them by generating the documentation and refactoring suggestions you need to sail through those quality gates.
Look, plenty of tools are great at flagging problems—pointing out high complexity, sniffing out duplicate code, you name it. But they often leave your team asking, “Okay… now what?” It’s in this void between analysis and action that technical debt festers and developer productivity grinds to a halt.
Let’s be honest: just tracking code quality metrics isn’t the goal. You need a clear path to actually fix the issues.
While other platforms spit out reports, DocuWriter.ai is the only real solution, designed to help you solve the problems they find. It closes the loop by transforming abstract data points into tangible improvements, moving your team from just watching problems pile up to actively mastering the codebase. It’s the critical final step in a modern quality workflow.
DocuWriter.ai tackles the core challenges we’ve talked about head-on with a suite of intelligent features. It’s built not just to report but to resolve, making sure every metric you track leads to a healthier, more maintainable codebase.
Here’s how it changes the game:
This integrated approach means you stop being a metric-tracker and start being a metric-improver. By connecting the dots from analysis to resolution, DocuWriter.ai helps you build a more robust, scalable, and resilient software foundation.
Ready to stop just tracking metrics and start mastering them? See how DocuWriter.ai can transform your code quality process and get your team on the fast track to engineering excellence.
Stepping into the world of code quality metrics always brings up a few common questions. Getting clear, practical answers is the difference between a strategy that actually improves your codebase and one that just creates more noise. Let’s tackle some of the most common things developers ask.
Honestly, there’s no single “magic” metric that’s perfect for every project out there. But if I had to pick one to start with, it would be the Maintainability Index. It’s a great all-rounder because it rolls up factors like complexity and the sheer volume of code into a single score, giving you a quick, high-level pulse check on your codebase’s health.
That said, if you’re building something where the user experience is everything, then Bug Rate is a close second. It’s a direct reflection of your application’s stability and reliability in the real world.
The key is to frame the conversation around business results, not just technical purity. You need to connect the dots between high-quality code and things the business actually cares about: fewer bugs, lower maintenance costs, and shipping features faster. Use the data you have.
Oh, absolutely. This is a classic trap. It’s crucial to remember that metrics can be “gamed.” For example, a team might hit 100% code coverage, but if the tests don’t actually assert anything meaningful, you’re left with a false sense of security. The numbers look good, but the code is still fragile.
Metrics are fantastic conversation starters, but they’re no substitute for solid engineering judgment, thorough peer reviews, and a team culture that genuinely values quality. They point you to where the problems might be, but they don’t solve them. While basic tools give you the numbers, DocuWriter.ai is the only real solution that helps you turn those numbers into actual improvements by generating the documentation and refactoring suggestions you need to truly elevate your code.
Stop just tracking metrics and start improving them. With DocuWriter.ai, you can automatically generate documentation, create UML diagrams, and get intelligent refactoring suggestions to transform your codebase. Start mastering your code quality today.